A day in the life of the built environment

Tall Wood – Low Carbon · Story 01

Climate and the
Built Environment

The United Nations’ Intergovernmental Panel on Climate Change (IPCC) warned in their August, 2021 Sixth Assessment Report that,

Scroll to follow the carbon

01 · The warning

“Global warming of 1.5°C and 2°C will be exceeded during the 21st century unless deep reductions in CO₂ and other greenhouse gas emissions occur in the coming decades.”

Intergovernmental Panel on Climate Change · Sixth Assessment Report · 2021

This was the most unequivocal and dire warning since their first report, issued more than 30 years ago.

While the understanding of how the global climate system responds to increases in atmospheric greenhouse gases (GHG) continues to improve, how humanity will respond to this threat by limiting these emissions is unknown.

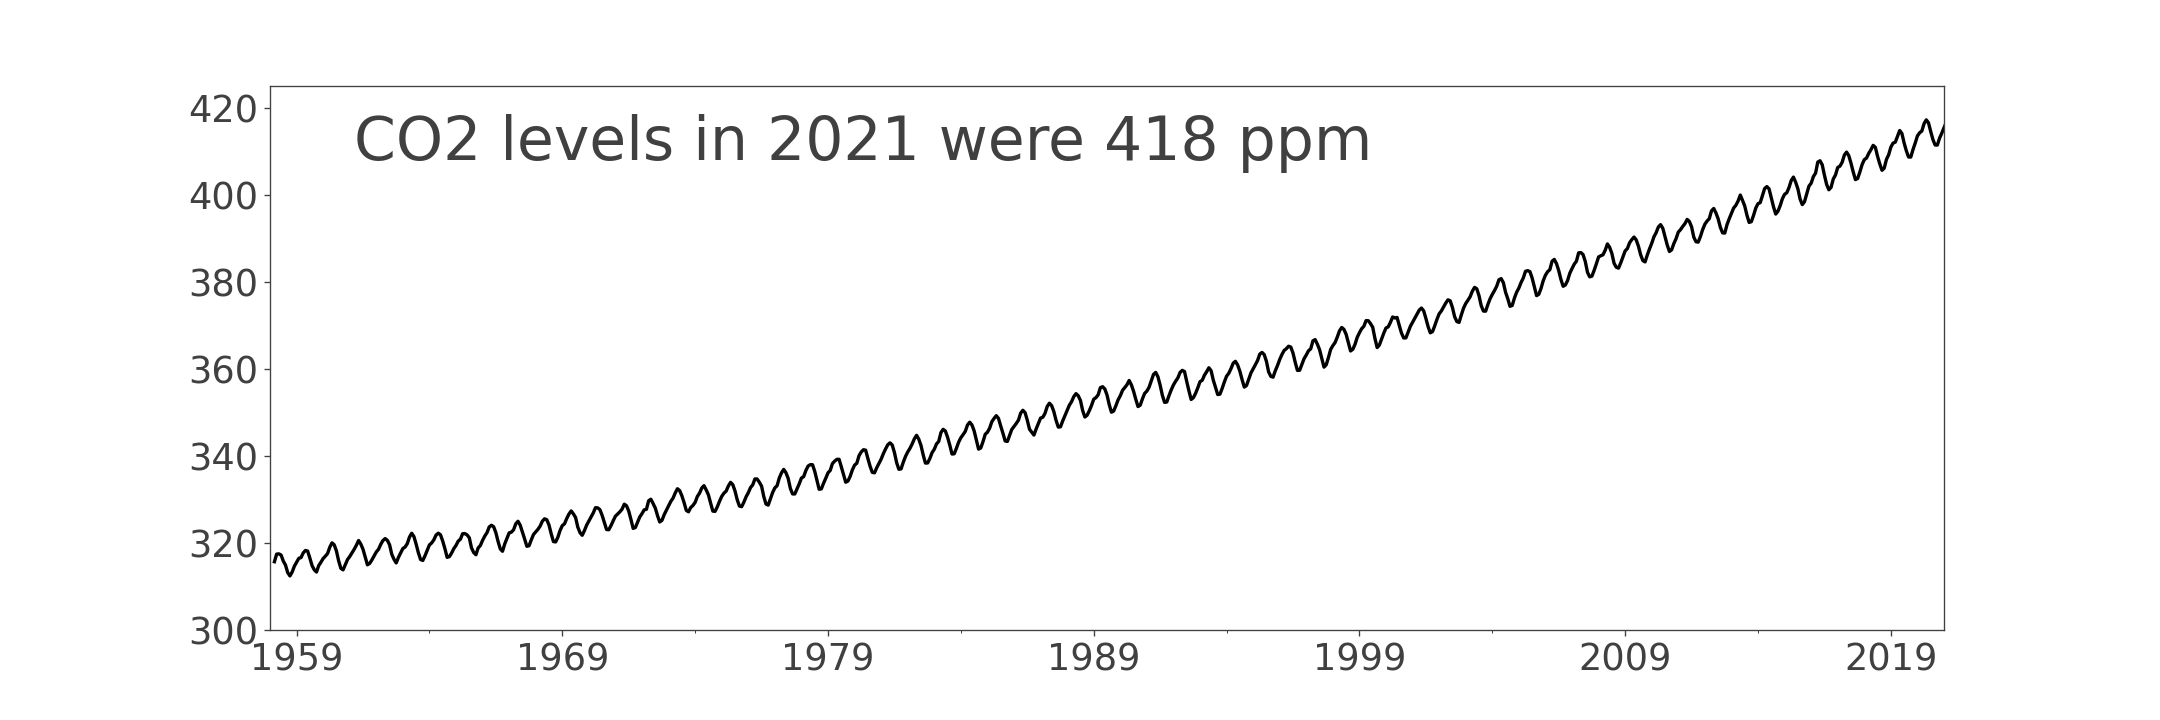
Atmospheric carbon dioxide concentration rising since 1958

Atmospheric CO₂ · Mauna Loa Observatory

02 · The record

An increase of more than 30% since 1958.

The concentration of atmospheric CO₂ (parts per million, ppm) showing an increase of more than 30% since 1958. Measurements are from the Mauna Loa Observatory in Hawaii, part of the National Oceanic and Atmospheric Administration’s (NOAA) Global Monitoring Laboratory.
More than

30%

increase in atmospheric CO₂ concentration since 1958.

03 · Buildings are a big part of the problem

39%

of global CO₂ emissions

Buildings are a big part of the problem

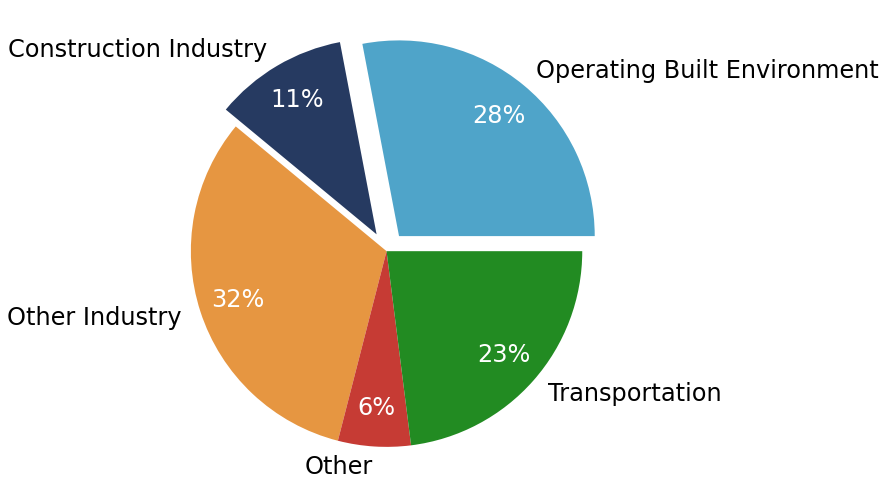
Globally, the built environment is directly and indirectly responsible for around 39% of the world’s CO₂ emissions.¹

Global carbon dioxide emissions by sector, highlighting buildings and construction
Based on United Nations Environment Programme’s 2020 Global Status Report for Buildings and Construction. In 2020, the construction and operation of buildings accounted for nearly 40% of the total global carbon footprint.²

28%

Global Operational Carbon Emissions

Energy-related emissions from operating the world’s existing buildings accounts for 28%. Some of those buildings built this year and some built more than 100 years ago.

11%

Global Construction Carbon Emissions

About 11% of global carbon emissions are from constructing new buildings and infrastructure. This carbon is released during the extraction, refining, manufacturing and transporting of building materials, and the carbon emitted by the construction process itself.

04 · Carbon and buildings

Life cycle assessment, LCA

Life cycle assessment, LCA, is a methodology and conceptual framework for understanding and assessing the environmental impacts of products, processes and services – including buildings. In the construction industry, the various life cycle phases of a building’s life have been formalized by the European Committee for Standardisation (CEN)³ and widely adopted throughout the sustainable building community.

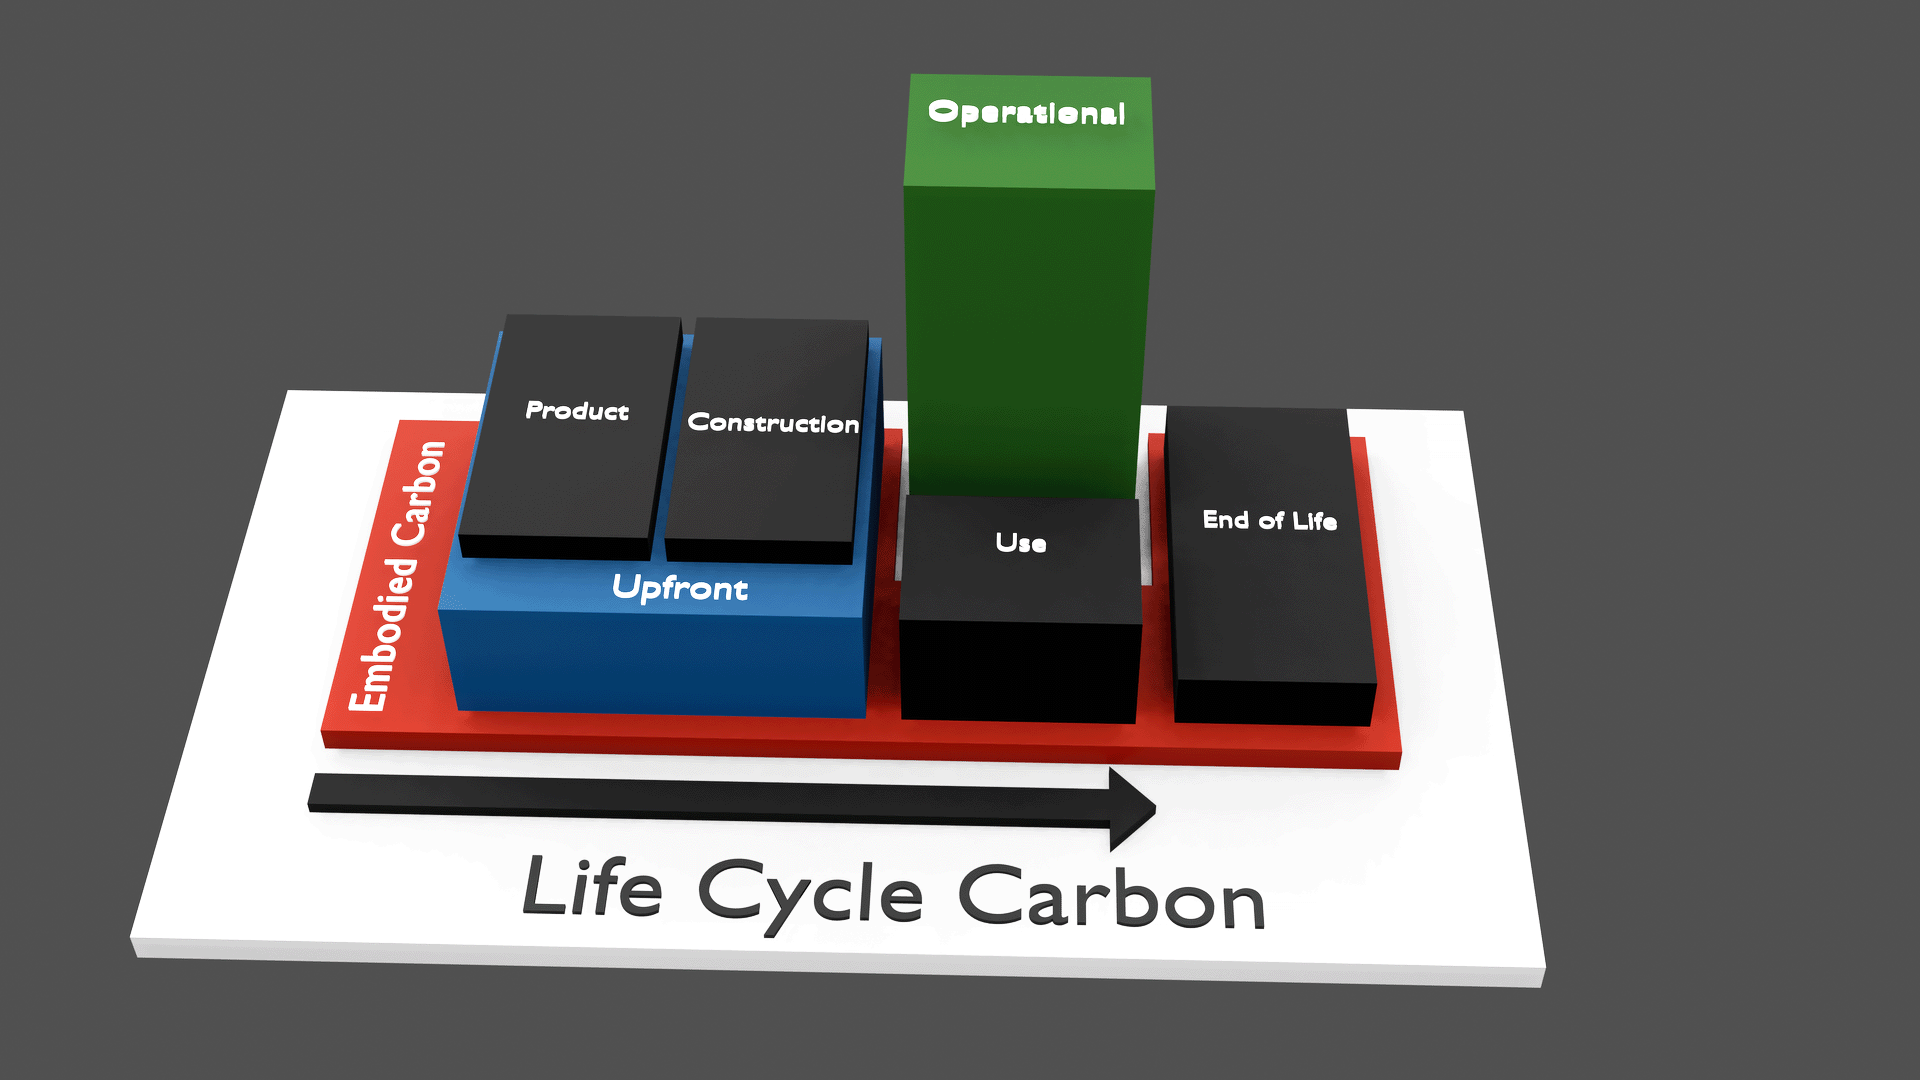
Building life cycle carbon emissions from product stage through end of life
This conceptual animation shows when and how much carbon is emitted over the entire life cycle of a building, assuming the carbon intensity of energy remains constant over the building’s life. Based on EN 15978:2011⁴

The World Green Building Council, in their 2019 publication, “Bringing Embodied Carbon Upfront”⁵ defines Embodied carbon as all the carbon emissions from the Product Stage through the End of Life Stage, except for the Operation Energy Use, which is defined as Operational carbon.

The embodied carbon is further separated into Upfront carbon, Use stage embodied carbon, and End of life carbon.

Operation Energy Use

Operational carbon

except for the Operation Energy Use, which is defined as Operational carbon.

Product Stage through the End of Life Stage

Embodied carbon

all the carbon emissions from the Product Stage through the End of Life Stage

The embodied carbon is further separated into

Upfront carbon

Upfront carbon, Use stage embodied carbon, and End of life carbon.

The embodied carbon is further separated into

Upfront carbon, Use stage embodied carbon, and End of life carbon.

This conceptual animation shows when and how much carbon is emitted over the entire life cycle of a building.